Synchrotron images from Zhou et al. (2014)
This example reproduces Figs. 5, 6 and 7 of [Zhou et al. 2014]. Many other figures of that paper can also be reproduced with slight modifications to these examples.
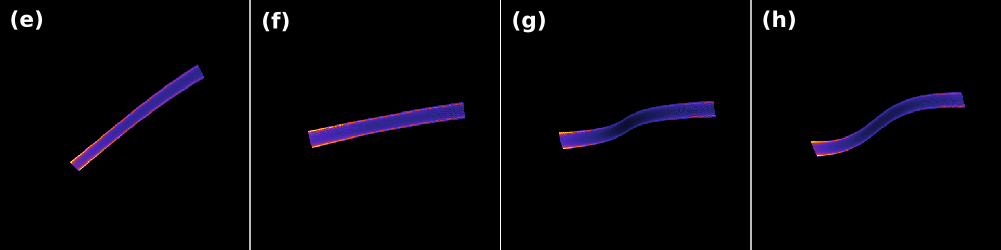
Figure 6 from |zhou2014|_, simulated using SOFT2. This figure illustrates how the radiation spot varies with the magnetic field safety factor.
Tokamak and detector properties
[Zhou et al. 2014] use an analytical magnetic field with circular flux surfaces, which happens to also be implemented in SOFT. The parameters of the magnetic field are as follows:
| Parameter | Value |
| Magnetic field on-axis | 2 T |
| Major radius | 185 cm |
| Minor radius | 45 cm |
| Toroidal field direction | Counter-clockwise (CCW) |
For the detector, the parameters used in [Zhou et al. 2014] are (note the directions of the axes in Fig. 4, which are different from how the corresponding axes are defined in SOFT)
| Parameter | Value |
| Position | \(148\hat{x} + 185\hat{y}\,\text{cm}\) |
| Viewing direction | \(\hat{y}\) |
Configuration scripts
Since all synchrotron images of [Zhou et al. 2014] are generated in very similar setups, we can benefit from splitting the configuration into multiple files. To this end, we have divided the problem into three levels.
The first level configures everything that is the same in all figures and is
represented by the file baseline in the top-level directory. Next, all
subfigures of each figure share some characteristics which are configured in
the files named FigXbase (with X replaced by the figure number). These
files include the baseline file at the top of the script. Finally, each
individual subfigure has its own configuration script. These configuration
scripts include the corresponding FigXbase script at the top.
Note
Tip 1 — While giving the camera a spectral range corresponding to the visible range (for example between 380-750 nm, as was used in the experiments) is more physically accurate, it makes comparison between SOFT simulations and [Zhou et al. 2014] more difficult, since [Zhou et al. 2014] only consider the spot shape and not the distribution of radiation across the spot.
| File | Description |
| baseline | Baseline configuration applied to all simulations. |
| Fig5/Fig5base | Baseline for all subfigures of Fig. 5 |
| Fig5/a | Configuration of Fig. 5(a). |
| Fig5/b | Configuration of Fig. 5(b). |
| Fig5/c | Configuration of Fig. 5(c). |
| Fig5/d | Configuration of Fig. 5(d). |
| Fig5/e | Configuration of Fig. 5(e). |
| Fig5/f | Configuration of Fig. 5(f). |
| Fig5/g | Configuration of Fig. 5(g). |
| Fig5/h | Configuration of Fig. 5(h). |
| Fig6/Fig6base | Baseline for all subfigures of Fig. 5 |
| Fig6/e | Configuration of Fig. 6(e). |
| Fig6/f | Configuration of Fig. 6(f). |
| Fig6/e | Configuration of Fig. 6(g). |
| Fig6/h | Configuration of Fig. 6(h). |
| Fig7/Fig7base | Baseline for all subfigures of Fig. 7 |
| Fig7/a | Configuration of Fig. 7(a). |
| Fig7/b | Configuration of Fig. 7(b). |
| Fig7/c | Configuration of Fig. 7(c). |
| Fig7/d | Configuration of Fig. 7(d). |